ELEMENTARY CLOUD Elementary Cloud automatically monitors the execution duration of your dbt models, seeds, and snapshots — detecting unexpected slowdowns before they affect your data consumers. TheDocumentation Index
Fetch the complete documentation index at: https://elementary-core-831-task-10-docs-update-elementary-oss-repo.mintlify.app/llms.txt
Use this file to discover all available pages before exploring further.
pipeline_task_performance monitor runs after each dbt job execution and compares the observed duration against a learned baseline or a fixed SLA threshold.
Monitoring modes
Anomaly detection (default)
The default mode uses a z-score seasonal model to learn normal execution duration for each dbt node. No configuration is required — Elementary automatically builds a baseline from your pipeline history. The model accounts for time-of-day and day-of-week seasonality. For example, a model that normally runs longer on Monday morning will not be flagged during that window.Static SLA
Static SLA mode lets you define a fixed duration threshold. The monitor fails whenever the observed execution time exceeds that threshold, regardless of historical behavior. Use static SLA when you have a contractual or operational hard limit (e.g., “this model must complete within 10 minutes”).Creating a monitor
Add Test wizard
The Add Test wizard supports models only. To add a
pipeline_task_performance monitor for seeds or snapshots, use the API.- Open the model in Elementary Cloud.
- Click Add Test → select Pipeline Task Performance.
- Choose the mode: Anomaly detection or Static SLA.
- Configure parameters (see Config reference below).
- Save.
API
Config reference
Anomaly detection mode
| Parameter | Description | Default |
|---|---|---|
mode | "anomaly" | "anomaly" |
sensitivity | Detection sensitivity: "low", "medium", "high" | "medium" |
training_period | Number of days used to build the baseline | 14 |
anomaly_direction | "spike" (duration longer than expected), "drop", or "both" | "spike" |
excluded_time_ranges | List of time ranges to exclude from training and detection | [] |
Static SLA mode
| Parameter | Description | Default |
|---|---|---|
mode | "static" | — |
fixed_threshold | Maximum allowed execution duration in seconds | Required |
Alerts and incidents
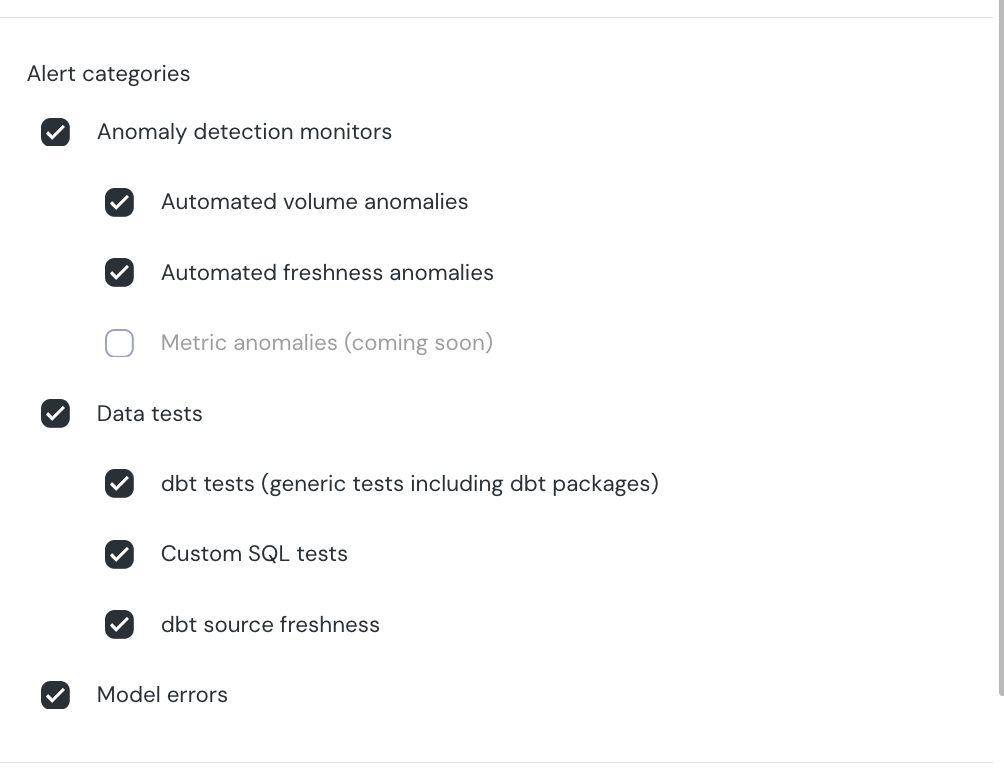
Failures frompipeline_task_performance raise alerts in the pipeline_performance alert category.
Alerts are routed through alert rules and delivered to all configured integrations:
Incidents are created and managed through the standard incidents workflow.
Activating alerts
By default,pipeline_task_performance alerts are not active. To enable them:
- Go to Setup → Alert Rules.
- Edit the default rule (or create a new one) and add Pipeline performance to the alert categories.
Related
- Pipeline task performance monitor — full monitor reference under Automated Monitors
- Performance monitoring dashboard — view execution trends in the UI
- Manual performance monitoring (dbt-package) — manual dbt-test alternative using
model_run_results